Press Release 21/11/2025
MIGRATORY MOVEMENTS STATISTICS. 2024
The migratory balance of the Basque Country was positive at 20,870 people in 2024
Almost 71.2% of immigrants and 51.2% of emigrants were foreign nationals
In 2024, the migratory balance remained positive, standing at 20,870 people, although it fell slightly compared to 2023 (20,928 people), down 0.3%, according to Eustat data. 58,977 immigrants arrived compared to 58,568 in 2023, an increase of 0.7%. Meanwhile, the number of emigrations rose by 1.2 %, going from 37,640 in 2023 to 38,107 in 2024.
The migratory balance followed a slight upward trend throughout the year: it was positive between January and June by 10,230 people, and higher in the second half of the year with 10,640 people.
By province, Bizkaia recorded the highest migratory balance, with 11,845 people, representing an increase of 1.9% compared to 2023. Gipukoa also had a positive balance, of 5,477 people, registering the most pronounced decrease (-10.2%). The balance in Álava was 3,548 people, up 10.6% compared to 2023.
As regards the capitals, all three recorded positive balances: 4,670 in Bilbao, 1,533 in San Sebastián and 2,767 in Vitoria-Gasteiz.
In relation to the movements that occur between the Basque Country and the other Autonomous Regions, there was a positive balance of 1,708 people in 2024, although this was lower than the balance registered in 2023, which stood at 1,814 people (-5.8 %). Meanwhile, the balance with foreign countries was also positive, standing at 19,162 people, slightly higher than in 2023(+0.25 %).
External or extra-community geographical mobility (i.e. changes of residence to or from locations outside the Basque Country) remained almost stable, going from 43.8 per 1,000 inhabitants in 2023 to 44 in 2024. By province, it was down 1.2 points in Álava, dropping to 47.3‰, while in Gipuzkoa and Bizkaia it increased by 0.3 points, rising to 41.4‰, and 0.5 points, increasing to 44.6‰, respectively.
Both immigrations and emigrations with other autonomous regions were concentrated in Andalusia, Cantabria, Castilla y León, Catalonia and Madrid
If we take into account the migratory movements with the different autonomous regions, the Basque Country maintained a positive migratory balance with 13 of them, while the balance with the other 4 was negative.
In order, the autonomous regions that attracted the most emigrants from the Basque Country were as follows: Castilla y León, Madrid, Cantabria, Catalonia and Andalusia. Between the five of them, they received 57.3% of the people who left the Basque Country for other regions. The total number of migrations to other autonomous regions was 19,322.
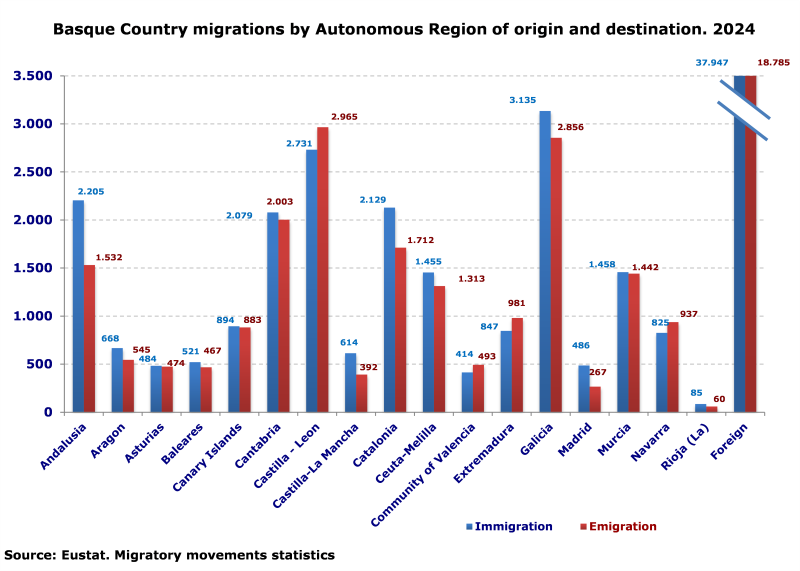
In descending order, the autonomous regions that contributed the most immigrants were as follows: Madrid, Castilla y León, Andalusia, Catalonia and Cantabria. Between the five of them, they contributed 58.4% of the total immigrants from the rest of Spain. The total number of migrations from other autonomous regions was 21,030.
Andalusia is the Autonomous Region with the highest positive balance, with 673 people, and Castilla y León has the most negative balance, with 234.
The average age of immigrants was 33.3 and that of emigrants was 37.4
The average age of immigrants increased from 33.1 in 2023 to 33.3 in 2024, while the that of emigrants increased from 37.1 to 37.4 in the same period. 50.9% of immigrations and 47.2% of emigrations were by people in the 20-39 age group. The most common age groups were 25-29, which accounted for 15.3% of immigrations and 13.8% of emigrations, and 30-34, which were responsible for 12.9% of immigrations and 13.1% of emigrations.
Differences in relation to gender increased slightly compared to the previous year: men represented 53.1% of immigrants and women 46.9%; similarly, 54.1% of emigrants were men and 45.9% were women.
The number of immigrations of foreign nationals stood at 42,003 in 2024, i.e. 71.2% of all immigrations. Of these, 34,345 came directly from a foreign country (81.8%) and the rest (7,658) came from another autonomous region (18.2%), primarily Madrid, Catalonia and Andalusia.
Emigrations of foreign nationals rose to 19,507, accounting for 51.2% of total emigrations. The destination for 73% of them was abroad. As a result, the migratory balance of foreign nationals was positive by 22,496 people in 2024, compared to 22,262 in 2023, i.e. 1.1% more than the previous year.
60.3% of the changes of residence among the Basque population occurred within the Basque Country itself
11.1% of the Basque population changed their place of residence in 2024, with this mobility being within the Basque Country on 60.3% of occasions, whilst in the remaining cases it was to outside the Basque Country.
In total, 244,809 changes of normal places of residence were recorded in the Basque Country. Of these, 91,318 were changes of address within the same municipality. Intra-community mobility, in other words, where the origin and destination are different municipalities of the Basque Country, increased to 56,407 movements.
There were also 58,977 cases of extra-community or external immigration, which are those that have their origin outside the autonomous region and where the destination is the Basque Country. Of these cases, 37,947 came from abroad, 2.3% more than in 2023.
Finally, there were 38,107 cases of external or extra-community emigration, in other words, changes in the place of residence from a municipality of the Basque Country to a destination outside the region, 49.3% (18,785) of which were abroad.
Evolution of migratory movements and balances. Basque Country. 1988-2024


| |
Immigration |
Emigrations |
Migratory balance |
| |
Total |
Variation rate (1988=100) |
Total |
Variation rate (1988=100) |
Total |
| 1988 |
8,014 |
100 |
18,103 |
100 |
-10,089 |
| 1992 |
9,006 |
112 |
13,668 |
76 |
-4,662 |
| 1995 |
11,316 |
141 |
16,130 |
89 |
-4,814 |
| 1999 |
16,103 |
201 |
17,291 |
96 |
-1,188 |
| 2000 |
20,022 |
250 |
17,462 |
96 |
3,903 |
| 2001 |
25,775 |
322 |
18,696 |
103 |
7,861 |
| 2002 |
25,967 |
324 |
19,730 |
109 |
6,082 |
| 2003 |
28,467 |
355 |
22,216 |
123 |
4,864 |
| 2004 |
30,328 |
378 |
21,304 |
118 |
8,116 |
| 2005 |
33,993 |
424 |
20,672 |
114 |
12,256 |
| 2006 |
37,147 |
464 |
22,689 |
125 |
11,827 |
| 2007 |
41,361 |
516 |
23,669 |
131 |
16,835 |
| 2008 |
44,630 |
557 |
29,941 |
165 |
14,689 |
| 2009 |
38,368 |
479 |
31,815 |
176 |
6,553 |
| 2010 |
38,591 |
482 |
33,425 |
185 |
5,166 |
| 2011 |
41,011 |
512 |
32,819 |
181 |
8,192 |
| 2012 |
34,362 |
429 |
34,589 |
191 |
-227 |
| 2013 |
33,987 |
424 |
35,943 |
199 |
-1,956 |
| 2014 |
35,491 |
443 |
31,889 |
176 |
3,602 |
| 2015 |
35,917 |
448 |
32,555 |
180 |
3,362 |
| 2016 |
40,126 |
501 |
31,255 |
173 |
8,871 |
| 2017 |
41,861 |
522 |
31,136 |
172 |
10,725 |
| 2018 |
46,982 |
586 |
32,258 |
178 |
14,724 |
| 2019 |
52,306 |
653 |
32,838 |
181 |
19,468 |
| 2020 |
35,221 |
439 |
30,709 |
170 |
4,512 |
| 2021 |
39,427 |
492 |
35,839 |
198 |
3,588 |
| 2022 |
59,194 |
739 |
37,023 |
205 |
22,171 |
| 2023 |
58,568 |
731 |
37,640 |
208 |
20,928 |
| 2024(p) |
58,977 |
736 |
38,107 |
211 |
20,870 |
(p)provisional data
Date November 21, 2025
Source: Eustat Migratory movement statistics
For further information:
Eustat - Euskal Estatistika Erakundea/Basque Statistics Institute
C/ Donostia-San Sebastián, 1 01010 Vitoria-Gasteiz
Press Service: servicioprensa@eustat.eus Tel.: 945 01 75 62